Pricing has never been guesswork; it’s a strategy backed by science. The Gabor Granger pricing method offers businesses a precise, data-driven way to uncover the ideal price customers are most likely to accept while still maximizing profit.
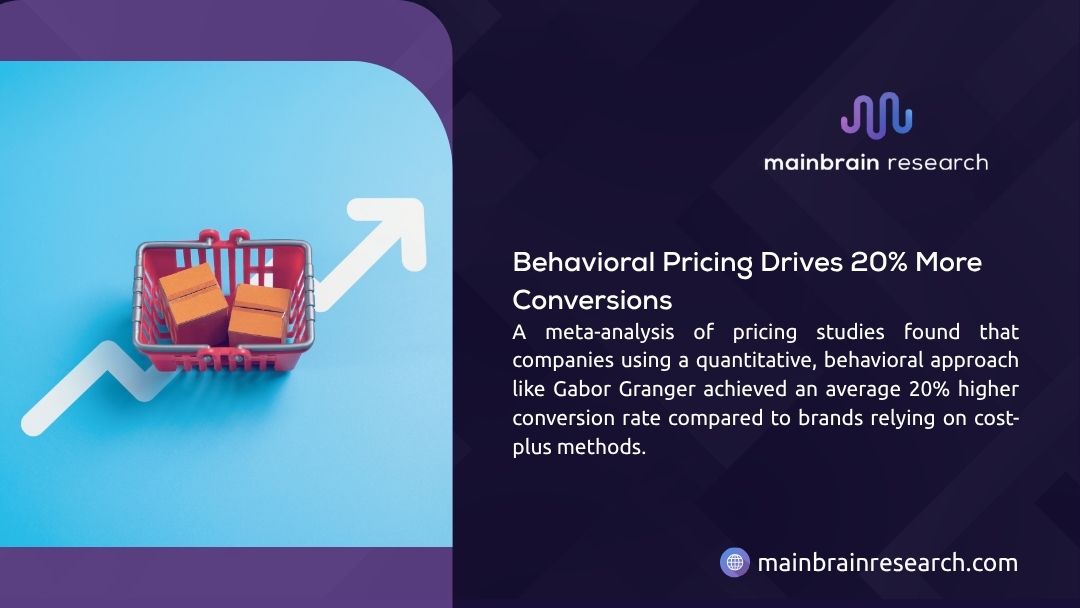
By testing how likely respondents are to purchase at multiple price points, this model builds a detailed picture of price sensitivity, optimal pricing, and consumer willingness to pay.
Developed by economists Clive Granger and André Gabor, the method has evolved into a core component of modern pricing research. It helps marketers, brand managers, and product strategists pinpoint pricing that balances market demand, perceived value, and revenue optimization, without relying on guesswork.
In this guide, you’ll learn how the Gabor Granger pricing method works, how it compares to the Van Westendorp model, how to design effective pricing surveys, and how real brands use these insights to shape winning strategies.
The article also explores how behavioral science and AI-powered analytics, like those used by MainBrain Research, transform pricing studies into profit-ready business decisions.
What Is the Gabor Granger Pricing Method?
The Gabor Granger pricing method is a structured quantitative research technique used to determine the ideal price customers are most likely to pay for a product or service. It was first conceptualized by economist Clive Granger (a Nobel Prize winner) and psychologist André Gabor, who recognized that understanding how people actually decide on price was far more powerful than simply asking what they think something is worth.
Unlike traditional pricing studies, which rely heavily on opinion or hypothetical satisfaction levels, Gabor Granger is built on behavioral intention. It asks respondents a series of pricing questions to measure their willingness to pay across multiple price points, producing a demand curve that visually represents purchase probability versus price.
This approach helps businesses identify three vital insights:
- The optimal price point where revenue is maximized.
- The price range that customers perceive as acceptable.
- The elasticity or sensitivity of customers to price changes.
The method is widely applied in consumer goods, technology, SaaS subscriptions, and retail sectors, where competition is tight and precision in pricing directly influences profit margins.
For readers looking to explore broader frameworks of how market insight drives business growth, MainBrain Research’s comprehensive guide to market research provides valuable context.
How the Gabor Granger Pricing Model Works
At its heart, the Gabor Granger model is elegantly simple. Respondents are shown a product or service description and asked whether they would buy it at a specific price. If they answer yes, the next question raises the price; if they answer no, it lowers it. This iterative process continues until the researcher identifies the price at which the respondent switches their answer.
The collected data across respondents creates a pattern, a price sensitivity curve, revealing the proportion of people who would purchase at each price. Analysts then identify the price that maximizes expected revenue, balancing higher margins against the probability of purchase.
| Step | Process | Purpose |
| 1 | Clearly describe the product or service | Ensure respondents evaluate the same value proposition |
| 2 | Present 5–7 ascending or descending price points | Measure price tolerance and thresholds |
| 3 | Ask if the respondent would buy at each price | Capture willingness to pay |
| 4 | Aggregate purchase probabilities | Generate demand and elasticity curves |
| 5 | Identify optimal price (revenue peak) | Pinpoint the most profitable pricing zone |
By analyzing these patterns, researchers can estimate both the upper price limit (where demand collapses) and the lower limit (where profit erosion begins).
MainBrain’s Logitivo platform enriches this process with AI-powered predictive analytics, simulating how various price scenarios impact revenue across demographics and regions. For a deeper look into the quantitative techniques behind such analysis, explore their quantitative market research guide.
Gabor Granger vs Van Westendorp: Key Differences
Although both models are staples of pricing research, their methodologies and insights differ in key ways. The Van Westendorp Price Sensitivity Meter focuses on perception, asking respondents when a product feels “too cheap” or “too expensive.” The Gabor Granger, on the other hand, is behavioral, asking how likely someone is to buy at specific price points.
Before diving into their comparison, it’s worth understanding that perception-based methods gauge emotional response, while behavioral models measure intent. Gabor Granger thus offers data that can directly inform financial forecasting.
| Feature | Gabor Granger Method | Van Westendorp Method |
| Question Type | “Would you buy this at X price?” | “At what price does this seem too cheap or too expensive?” |
| Output | Optimal price and demand elasticity | Acceptable price range (cheap/expensive thresholds) |
| Focus | Actual purchase intent | Perceived value and fairness |
| Best For | New products or market entries | Established brands with existing price perceptions |
| Data Type | Quantitative | Attitudinal |
Many organizations use both approaches in tandem: Van Westendorp defines the boundaries of acceptable pricing, while Gabor Granger identifies the precise profit-maximizing point within that range. A detailed look at how these approaches complement qualitative data is available in MainBrain’s ethnographic market research guide.
Designing Effective Gabor Granger Pricing Questions
The success of this pricing method depends on the question design. Each question must isolate pricing as the variable while holding other product attributes constant. Researchers typically define a base description that includes clear value statements and feature details. This prevents misunderstanding or bias.
Questions should cover realistic prices within the target market range, usually in evenly spaced intervals. Asking too many levels risks fatigue; too few reduces granularity. Consistency in wording helps respondents compare prices objectively.
For instance, one could phrase it like this: For $25 per month for full access to premium features and dedicated customer support, how likely are you to subscribe?”
Responses such as definitely would buy or definitely would not buy are then quantified to assign probabilities. Randomizing price order helps counter response bias. Designing strong, unbiased questions ensures reliability, a principle elaborated in MainBrain’s market research questions framework.
Conducting Gabor Granger Surveys: Step by Step
Running a Gabor Granger study involves structured execution—from planning through analysis. Each phase refines data integrity and validity.
| Phase | Action | Objective |
| Planning | Define the respondent profile and sample size | Represent target demographics |
| Setup | Program price ranges and question flow | Maintain consistency across participants |
| Fieldwork | Deploy through digital surveys or interviews | Collect responses efficiently |
| Cleaning | Remove incomplete or biased data | Maintain dataset credibility |
| Modeling | Analyze response distribution | Construct a sensitivity curve |
Once responses are gathered, data is aggregated to reveal a purchase probability matrix. Analysts can visualize how many customers are likely to purchase as prices increase. This insight provides not just the “right price,” but also shows how much demand you lose with each incremental rise.
For small and emerging companies, MainBrain’s startup research guide outlines how to adapt these methods cost-effectively without compromising accuracy.
Analyzing Gabor Granger Data
The power of Gabor Granger lies in its analysis. After plotting cumulative responses, researchers identify where purchase intent begins to sharply decline; this marks the upper limit of acceptable pricing.
| Metric | Purpose | Interpretation |
| Cumulative Purchase Rate | Indicates the total likely buyers at each price | Helps detect price sensitivity |
| Expected Revenue | Price × Purchase Probability | Reveals peak profitability |
| Elasticity Index | Measures demand shift per price change | Defines flexibility |
| Optimal Price | Highest revenue intersection | Pinpoints actionable pricing |
With modern analytical tools, researchers can even segment price elasticity by demographics, usage patterns, or psychographic traits. This makes it possible to tailor price tiers or regional strategies. More advanced practitioners can learn from MainBrain’s conjoint analysis guide for integrating attribute-based pricing decisions.
Real-World Applications and Case Studies
In practice, the Gabor Granger method proves invaluable across industries.
Case Example 1 – Retail Beverage Brand: A drinks manufacturer tested six price points from $1.00 to $2.50. The data revealed a strong demand peak at $1.75, producing 18% higher sales volume post-launch. The pricing adjustment not only increased profit margins but also reinforced brand affordability perception.
Case Example 2 – SaaS Subscription Service: A software platform conducted Gabor Granger testing on subscription plans. AI-assisted analysis from MainBrain’s Logitivo platform identified $19.99 as the revenue-maximizing tier. Post-adjustment, conversions rose 27%, with no negative effect on customer satisfaction.
For organizations seeking end-to-end pricing support, MainBrain’s strategic solutions service details how such studies integrate into full-scale market strategies.
Integrating Behavioral Science into Pricing Research
While Gabor Granger provides the numbers, behavioral science explains why those numbers exist. MainBrain’s Revel division integrates neuroscience to understand emotional and cognitive triggers that influence pricing acceptance.
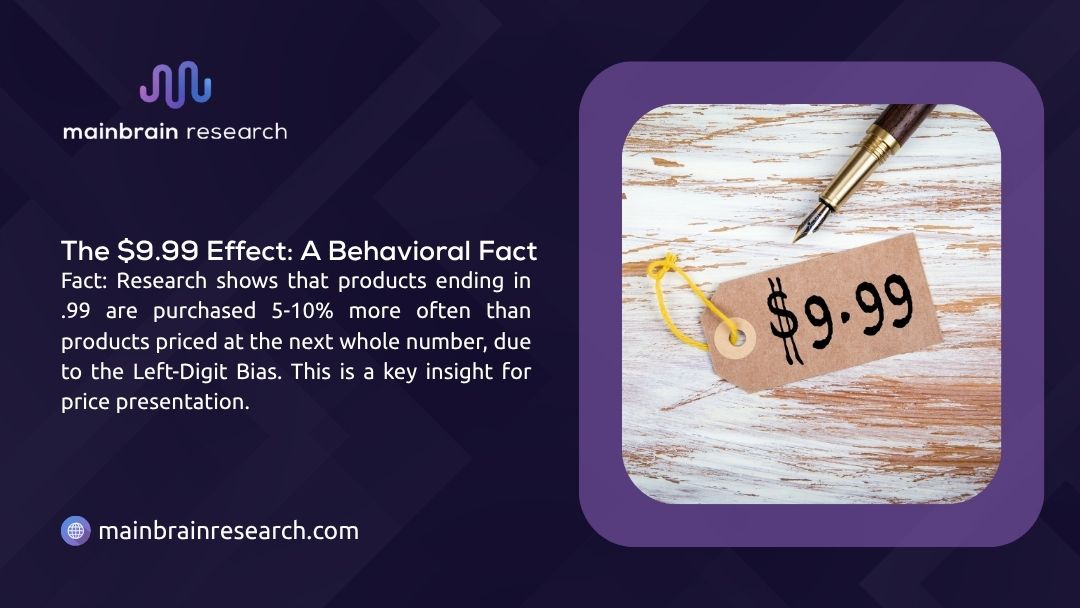
For instance, subtle shifts in phrasing (“premium” vs. “exclusive”) or numerical presentation ($20.00 vs $19.99) activate different value perceptions in the brain. This is due to left-digit bias and reward-system activation patterns proven in consumer neuroscience.
Merging these findings with Gabor Granger data allows analysts to predict not only what people say they’ll pay, but what they’ll actually do. To explore related psychological techniques, check MainBrain’s breakdown of different types of market research surveys.
Benefits and Limitations of the Gabor Granger Method
The model’s strength lies in its simplicity and empirical grounding. However, like any research tool, it’s not without trade-offs.
| Dimension | Advantages | Limitations |
| Accuracy | Quantifies purchase intent across precise prices | May overestimate buying probability |
| Efficiency | Quick, scalable, and cost-effective | Lacks emotional context |
| Flexibility | Applicable to any product type | Struggles with luxury or abstract services |
| Decision Support | Provides actionable revenue forecasts | Requires supplementary qualitative research |
Interpreting these findings responsibly ensures strategic balance, data accuracy paired with real-world awareness. To better understand how research investments pay off, MainBrain’s article on the benefits of market research outlines ROI benchmarks and validation methods.
Expert Insights: When to Use Gabor Granger Pricing
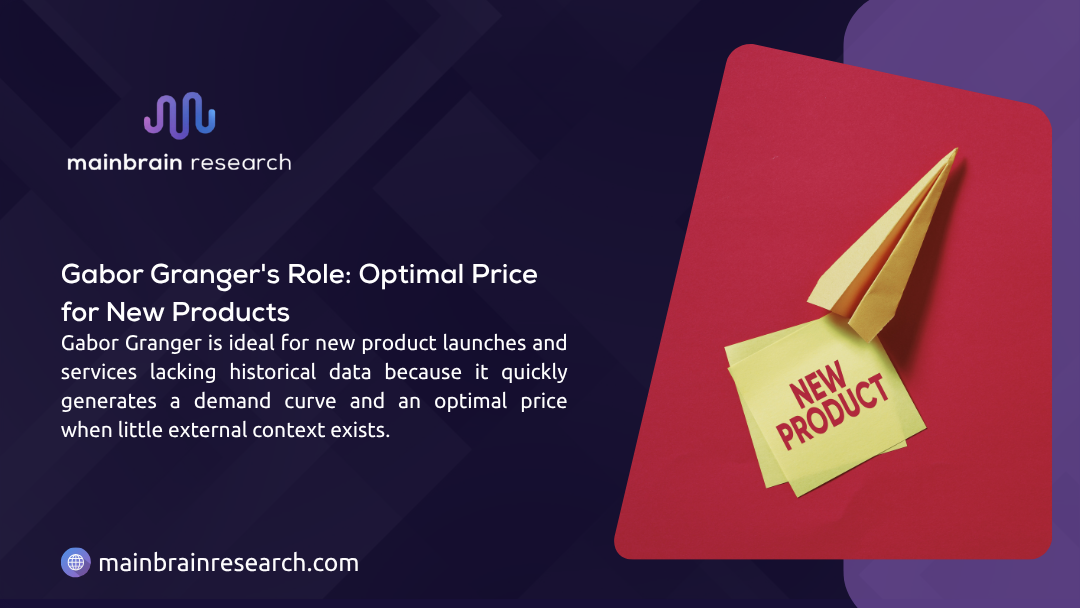
The Gabor Granger method is most powerful in scenarios where quick, data-driven decisions are needed. It’s ideal for new product launches, subscription pricing models, and testing promotional elasticity. Companies use it when historical pricing data is limited, but decisions must be evidence-based.
For mature brands, it’s valuable in repositioning or price adjustment phases to ensure changes align with evolving consumer perception. Integrating this model with Van Westendorp for perception analysis and Conjoint Analysis for product-attribute trade-offs delivers a multidimensional view of pricing potential.
MainBrain Research often implements such hybrid designs using AI-powered modeling detailed within their technology and methodology platform, ensuring adaptability across industries and regions.
Key Takeaways
| Insight | Recommended Action |
| Gabor Granger turns buyer intent into measurable pricing insights | Apply it early in market testing |
| Behavioral science amplifies accuracy | Use neuro-based interpretation to decode decisions |
| Combining models ensures balance | Pair with Van Westendorp or Conjoint Analysis |
| Continuous research maintains relevance | Reassess as consumer and market conditions shift |
Transforming Data into Pricing Power
Accurate pricing drives profitability, and the Gabor Granger method provides a structured path to achieve it. By combining statistical precision with behavioral understanding, businesses can uncover how consumers truly value what they buy.
Whether you’re preparing to launch, expand, or recalibrate, MainBrain Research’s expert consultants can help you apply data-backed pricing models tailored to your market. Discover how strategic research turns insights into measurable growth by connecting with their pricing specialists today.