Setting the right price isn’t guesswork; it’s behavioral economics in action. The Van Westendorp Pricing Model, created by Dutch economist Peter Van Westendorp, remains one of the most accurate frameworks for identifying what customers consider too cheap, too expensive, or just right. By asking four simple price-perception questions, brands uncover the optimal price point that balances profit and demand.
In this guide, we’ll unpack how the Van Westendorp Price Sensitivity Meter works, how it compares with models like Conjoint Analysis and Gabor-Granger, and how platforms like Qualtrics make the process seamless.
You’ll also see real-world cases showing how consumer brands and SaaS companies use these insights to predict price acceptance, reduce churn, and optimize product launches.
Whether you’re a market researcher, brand strategist, or entrepreneur, this article shows how to apply the model step-by-step and where MainBrain Research fits in, turning behavioral data into growth-ready pricing strategies.
What Is the Van Westendorp Pricing Model?
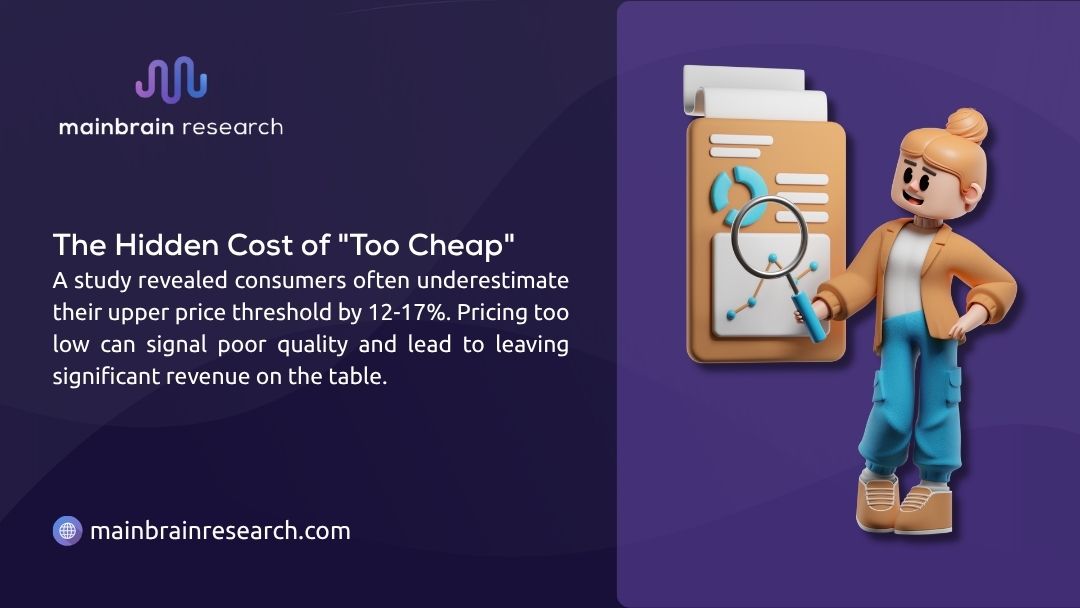
The Van Westendorp Pricing Model is a data-driven method for determining what customers perceive as an acceptable and optimal price for a product or service. Instead of assuming what the “right” price should be, it asks consumers to define their own boundaries of value, revealing how price shapes perceived quality, affordability, and desirability.
At its core, the model transforms subjective opinions into measurable data. By analyzing responses to four targeted pricing questions, researchers can pinpoint the acceptable price range (from the Point of Marginal Cheapness to the Point of Marginal Expensiveness) and the Indifference Price Point, where buyers feel the product is priced fairly.
It’s a method widely used in market research for pricing new concepts, testing rebrands, or identifying where customer trust begins to waver. Unlike guesswork or gut instinct, it translates psychology into precise, actionable numbers, a perfect example of how behavioral science and analytics intersect.
Origin and Background
The model was developed in 1976 by Dutch economist Peter Van Westendorp, who sought to connect consumer perception with quantitative analysis. His insight was simple yet revolutionary: consumers can’t always articulate their willingness to pay directly, but they can describe when a price starts to feel too cheap or too expensive.
By mapping those responses statistically, Van Westendorp introduced a behavioral pricing framework that is now fundamental across industries, from FMCG and retail to SaaS and digital services.
His work laid the foundation for what modern analysts call the Price Sensitivity Meter (PSM), a tool that has since evolved through digital survey platforms like Qualtrics and advanced AI-based analysis used by consultancies such as MainBrain Research.
The Four Price Questions
The Van Westendorp survey consists of four direct yet psychologically revealing questions:
- Too Cheap: At what price would you consider this product so inexpensive that you’d doubt its quality?
- Cheap: At what price would you think it’s a bargain or good value for money?
- Expensive: At what price would you begin to feel it’s getting costly but still worth considering?
- Too Expensive: At what price would you feel the product is so overpriced you would not buy it?
When these responses are plotted cumulatively, the intersections highlight price thresholds, offering clarity on where to price confidently without alienating potential buyers.
Why Businesses Use the Van Westendorp Price Sensitivity Meter?
Every brand faces the same challenge: how to price competitively without eroding value. The Van Westendorp Price Sensitivity Meter bridges this gap by turning consumer psychology into a visual pricing framework. It helps companies see not only what customers can afford but also how they interpret worth.
By analyzing the curves created from survey data, decision-makers uncover both the emotional and rational sides of purchase behavior. It’s particularly effective for new product development, market entry studies, and pricing repositioning.
Benefits for Product and Service Pricing
| Advantage | Description |
| Simplicity | The model uses only four questions, reducing cognitive load for respondents. |
| Affordability | Requires smaller sample sizes (150–300 respondents), making it efficient for startups and large corporations alike. |
| Versatility | Works across consumer goods, B2B services, and digital subscriptions. |
| Actionable Insights | Defines the acceptable price range and optimal price point with high precision. |
| Behavioral Clarity | Links perceived value with emotional response, ideal for brand strategists and researchers. |
Beyond numbers, the model’s biggest strength lies in its behavioral interpretation; it shows why customers reject or accept a price. That psychological layer is what makes it invaluable for agencies conducting consumer insight research or designing brand positioning studies.
Limitations and Best Use Cases
While powerful, the model isn’t flawless. It assumes buyers evaluate price rationally, which isn’t always the case in emotional or luxury markets. It’s also less effective for products with rigid price anchors (like gasoline or gold), where perception has little influence.
| Limitation | Explanation |
| Static Context | Works best in pre-launch or testing phases, not real-time dynamic pricing. |
| Consumer Bias | Respondents may understate or overstate true willingness to pay. |
| Lack of Competitive Framing | The model isolates the product, not its market alternatives. |
| Cultural Variance | Sensitivity varies across regions; localized research is essential. |
Despite these boundaries, the Van Westendorp method remains the most cost-effective entry point into pricing research. For teams integrating it with tools like AI-driven predictive analytics, such as MainBrain’s Logitivo platform, the results become exponentially more precise, enabling dynamic updates as market sentiment shifts.
How to Conduct a Van Westendorp Pricing Survey
Executing a Van Westendorp pricing study is straightforward but requires methodological discipline. Every detail, from how you frame your product to the order of questions, affects the accuracy of your curves. Before beginning, researchers must define clear goals: are they testing a new launch, validating an existing price, or exploring market expansion?
The process can be executed through in-house surveys or with the support of professional market research partners who specialize in quantitative and behavioral modeling.
Step-by-Step Methodology
Below is a streamlined structure for running the model effectively:
| Step | Action | Purpose |
| 1 | Present a clear product or service concept | Respondents need context to answer meaningfully. |
| 2 | Select a target audience that mirrors your customer base | Ensures relevant, reliable perception data. |
| 3 | Ask the four Van Westendorp questions | Collects responses on perceived pricing thresholds. |
| 4 | Gather at least 150–300 completed surveys | Provides statistical validity. |
| 5 | Plot the cumulative response curves | Visualize how perception shifts across price points. |
| 6 | Identify intersections (PMC, PME, IPP) | Extracts the acceptable range and optimal price. |
| 7 | Validate with follow-up qualitative feedback | Confirms that numeric findings align with real-world sentiment. |
Many researchers now conduct this process through Qualtrics, an advanced survey platform that allows easy visualization and cross-analysis. By automating curve plotting and response segmentation, it minimizes human error and saves hours of post-processing.
When the results are visualized, you’ll see four intersecting curves, each representing how many respondents found a price too cheap, cheap, expensive, or too expensive. The crossover areas reveal the psychological comfort zone where consumers feel confident purchasing.
How to Analyze Results
The key to interpreting results lies in understanding how perception transforms into thresholds. The table below outlines the standard interpretation metrics:
| Key Metric | Definition | Strategic Takeaway |
| Point of Marginal Cheapness (PMC) | Intersection of “Too Cheap” and “Expensive” | The minimum price consumers still associate with acceptable quality. |
| Point of Marginal Expensiveness (PME) | Intersection of “Too Expensive” and “Cheap” | The ceiling before price resistance spikes. |
| Indifference Price Point (IPP) | Where “Cheap” and “Expensive” curves intersect | The price which perceptions of value and cost balance. |
| Optimal Price Point (OPP) | The midpoint between PMC and PME | The most profitable, perception-safe price. |
The outcome is not a fixed price but a data-backed confidence interval, a range where buyers are least price-sensitive and most open to purchase. For deeper reliability, researchers often merge Van Westendorp data with transactional data or advanced quantitative analysis methods used in primary market research.

Comparing Van Westendorp with Other Pricing Models
No single pricing framework fits every product. To maximize insight, analysts often compare the Van Westendorp model with alternative pricing tools that test demand elasticity and attribute-driven choice.
Before choosing your model, you must understand whether your goal is perception measurement (how customers feel about price) or behavioral forecasting (how they act when prices change).
Conjoint Analysis vs. Van Westendorp
Conjoint Analysis dissects how customers value product features relative to price. It’s a multivariate approach that measures trade-offs, ideal for complex products like electronics, software, or automotive services, where price is only one factor among many.
By contrast, Van Westendorp isolates price perception itself, ignoring brand or feature bias. It’s faster, easier to execute, and perfect for early-stage concept testing where you just need to know “what feels right” to customers.
Conjoint provides depth, but Van Westendorp offers clarity. Many teams integrate both methods: Van Westendorp for initial pricing boundaries and Conjoint to refine value-based pricing later. This complementary use mirrors the approach taken in quantitative market research projects conducted by leading consultancies.
Gabor-Granger and Other Price Sensitivity Tools
Another popular model is the Gabor-Granger method, which measures purchase intent at fixed price points rather than perception. Respondents are asked, “Would you buy this product at X price?” across multiple levels, allowing researchers to build demand curves and estimate revenue potential.
Where Van Westendorp identifies acceptable ranges, Gabor-Granger predicts conversion likelihood. Combining both provides a full picture, one describing attitude, the other showing action.
Modern researchers increasingly use AI-driven sensitivity meters to merge these datasets, feeding algorithms that learn from behavioral and survey inputs simultaneously. Firms like MainBrain Research already apply such hybrid models in advanced pricing optimization studies, giving brands a predictive edge in volatile markets.
Real-World Application and Case Studies
Theory becomes meaningful only when proven in real business conditions. The Van Westendorp Pricing Model has helped both established corporations and scaling startups uncover pricing blind spots that traditional research often misses.
In one instance, a SaaS company preparing to launch a tiered subscription model used a Qualtrics survey featuring the four Van Westendorp questions. With over 250 qualified responses, the acceptable price range emerged between $15 and $40, with the Indifference Price Point around $27.
Launching at $28 led to higher conversion and 17% longer customer retention over six months. The data aligned with usage metrics, confirming that the perceived value matched the actual product experience.
A separate consumer-goods brand tested three packaging sizes for a premium snack line. Using Van Westendorp analysis during its market research phase, the brand found the Point of Marginal Cheapness at $0.80 and the Point of Marginal Expensiveness at $2.00.
Launching at $1.39, right near the model’s Optimal Price Point, boosted trial rates and shelf turnover by nearly 20%. The study also informed messaging: customers equated slightly higher prices with freshness and quality, validating behavioral insights the company hadn’t considered before.
Across industries, the pattern repeats: businesses using consumer perception data outperform those relying on intuition alone. Integrating the Van Westendorp framework with AI and behavioral analytics, as MainBrain does, transforms raw opinion data into living intelligence, capable of guiding pricing, packaging, and long-term product strategy.

Integrating Van Westendorp into Your Pricing Strategy
Applying this model effectively means more than running a survey; it requires aligning research insights with brand positioning and business goals. The process typically begins with foundational market research to identify your target audience, followed by defining clear hypotheses: what perception are you trying to validate or change?
Once you’ve established the scope, design your questionnaire with neutral wording to avoid bias, then use a trusted digital platform like Qualtrics to deploy it efficiently. After analyzing your data, validate it through pilot sales or focus group testing to see whether the predicted optimal price point holds up in real conditions.
To move from insight to action, connect your results with behavioral and contextual data, how consumers react to packaging, marketing, and brand trust. That’s where MainBrain Research’s Strategic Solutions team excels, transforming static survey data into live pricing frameworks that adjust to evolving markets.
Similarly, its Brand Building and Positioning division helps ensure pricing reflects not just affordability but perceived premium value, creating a coherent message from shelf to sale.
The Van Westendorp model offers clarity, but strategic interpretation ensures those insights lead to measurable results. When integrated into a long-term pricing strategy, it becomes a competitive compass, guiding product, marketing, and innovation decisions with data-backed confidence.
Key Takeaways
| Insight | Why It Matters |
| Consumers Define Value | Price signals quality, trust, and desirability more than cost. |
| Four Questions Reveal Boundaries | The PSM framework identifies psychological thresholds quickly. |
| Optimal Price Point = Balance | Aligns brand value with customer expectations. |
| AI + Behavioral Science Strengthen Accuracy | Real-time data makes pricing agile and market-relevant. |
| Pre-Launch Testing Saves Margin | Avoids underpricing or consumer pushback. |
Every Price Tells a Story: Make Yours Worth Paying For
A well-chosen price communicates value before a single word of marketing is spoken. The Van Westendorp Pricing Model provides the evidence behind that intuition, combining behavioral economics with clear, testable metrics.
When enhanced by AI-driven analytics and neuroscience-based behavioral insight, as practiced by MainBrain Research, pricing becomes not just a financial decision but a strategic narrative.
Whether you’re refining an existing product or entering a new market, understanding your customer’s price perception is the first step toward sustainable growth.
To uncover your product’s true value window, connect with the MainBrain Research team through their contact page and explore how customized pricing and innovation studies can reveal the price that feels just right, for both your customers and your bottom line.